What were the challenges?
- Heavy reporting and administrative work for engineers
- Limited visualisations and accessibility to handover progress
- Easy to miss out defect items as information is decentralised
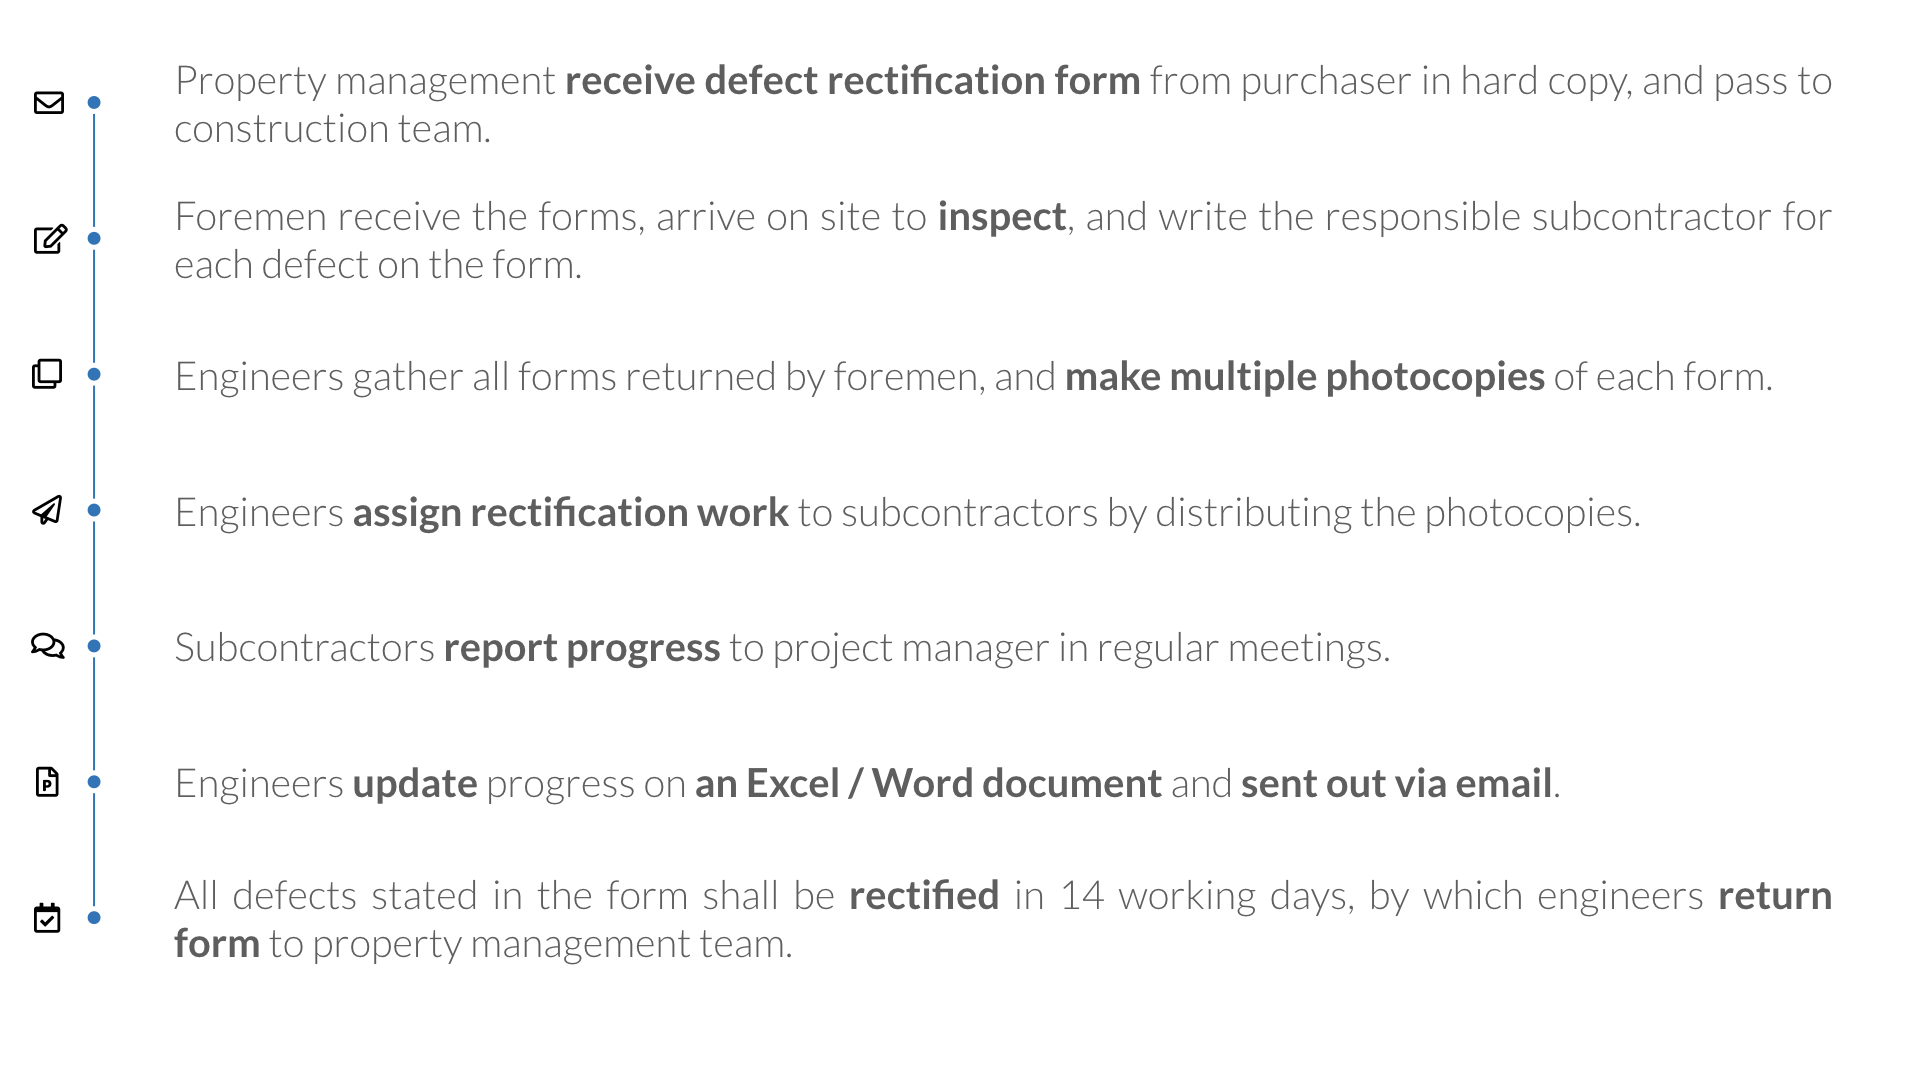
Process Before Implementing SnagR
Reports Before Implementing SnagR
Engineers had to manually count forms and defect items, manually update figures on a Word document, and manually highlight unit with colours to indicate handover status. The reports are updated everyday, printed and pinned on a board in the meeting room. The reports are also sent to property management at the end of each day as a progress update. This was a time-consuming process and is prone of human error.

How can SnagR help?
- Digitalise inspection process and reduce subsequent administrative work
- Visualise progress and highlight outstanding items by due date
- Analyse defect types and subcontractor performance easily
Process After Implementing SnagR

In replacement of the paper-based system, foremen and engineers use SnagR app / website as a centralised platform to record and update information for each unit in the handover process:

Reports After Implementing SnagR
As soon as foremen add and update defects via mobile app, and engineers input details for each unit, the following reports will be generated automatically:

The summary page shows the overall status in handover and highlight events of the day, e.g. booking appointments with purchaser to collect keys, and defect rectification forms received. The colour for each unit represents its handover stage, i.e. invited purchasers to collect keys, purchaser made booking to collect keys, purchaser collected keys, etc.

The table on the left shows all defect rectification form submissions in the last 30 days, and includes details such as if the purchaser has left behind keys or not otherwise the team needs to make separate booking with the purchaser to perform a fix. The chart on the right shows the total number of defects reported by the purchaser, and the colours indicate the progress of rectifying these defects.

These bar charts highlight the performance of subcontractors by the number of defects they have been assigned to and the number of working days they used / have left to close a defect.

This table is simply a summary of all defect items reported by the purchasers. The table can be filtered by block, unit, defect status, contractor and remaining working days to fix it.
The data refreshes every hour from 9 am to 6 pm.
What is required to set this up?
- Layout plans per unit in PDF, png or jpeg (drawing title naming standard: [block]-[unit])
- List of users and contractors on the project
- List of standard issues / descriptions
- Which city is the project located? (to identify public holidays and calculate working days)
- Is the developer obliged to close defects within a certain number of working days by contractual terms?
- Does the property management office use Google Calendar to record appointment bookings with the purchasers?
Note
Here are the main features used in SnagR: